Where We Work - Interactive Mapping
“Behind every good man / woman / organization, there is…. “
You know the quote.
In the case of WCAHS, this is our Evaluation Core, headed by Dr. Julie Rainwater.

Often working in the background, Evaluation is constantly monitoring WCAHS activities to determine which planned activities are successfully carried out and whether expected outcomes have been achieved.
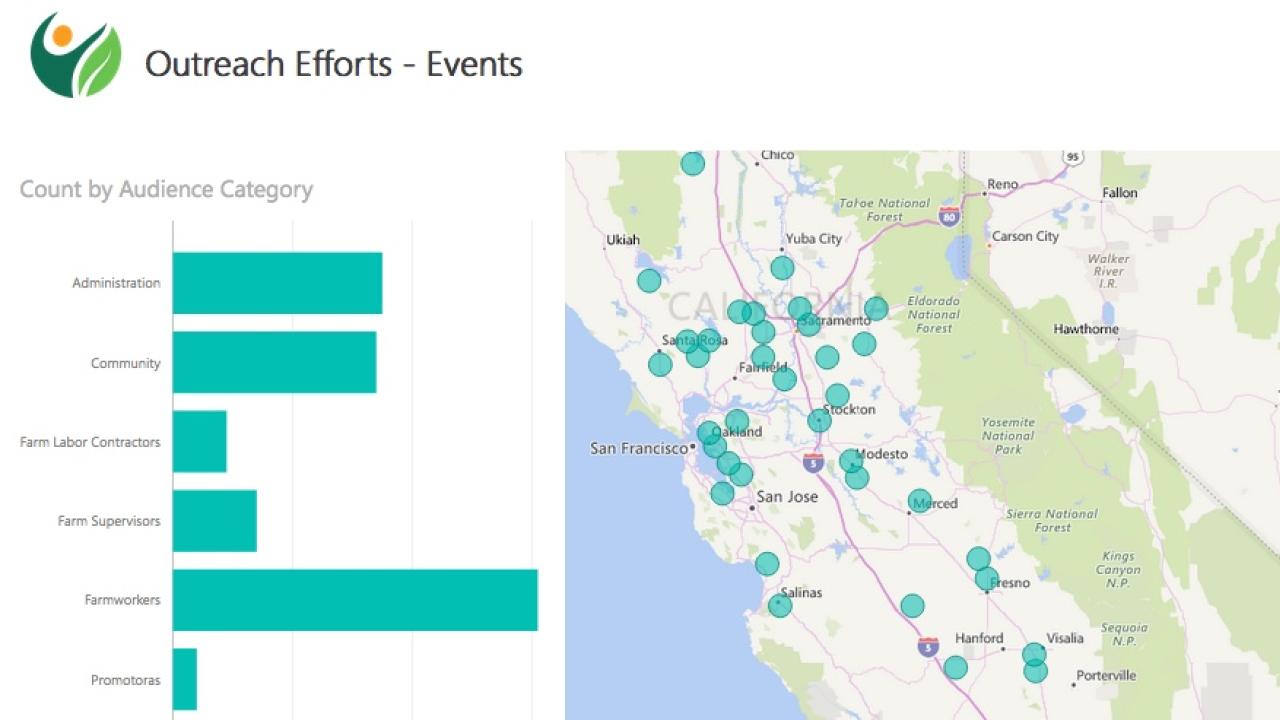
A new interactive map of WCAHS activities has been added to the process by Evaluation Specialist Stacey Neves. Using Microsoft Power BI software, Stacey created three individual maps showing the distribution of Outreach Events, Research Sites, and Stakeholders and Advisors using 2011-present data. A fourth map combines all of the information for a complete display of WCAHS activities across its region of Arizona, California, Hawai’i and Nevada.

Stacey pointed out that this type of collaborative mapping quickly “shows where WCAHS is active and where it has room to grow and expand.“ For example, while WCAHS-sponsored research is regionally spread out, it is evident that outreach activities have been largely limited to California.
A long-standing goal of WCAHS is to have a greater presence in the three other states it represents, and the maps will be used to help identify areas of strength and opportunity and direct strategic planning.
Stacey chose Microsoft Power BI software because of its user-friendly interface and ease of importing and mapping existing databases, such as Excel. Maps can be shared and used to track progress over time. They will constantly evolve, as revisions / updates are made based on feedback and time.
WCAHS leadership thanks the Evaluation Core for this new tool that will help improve planning and stakeholder outreach.
